📌 Start your Data Science Journey with these Must-Know Python Tools
Are you starting your career in data science and wondering which Python libraries are worth learning first? Whether you’re a student, a fresher, or switching careers into tech, Python offers a goldmine of libraries that make data analysis, machine learning, and visualization super easy and efficient.
In this blog, we’ll cover the top Python libraries that every data scientist (especially beginners!) should know—complete with simple examples to help you understand how they work.
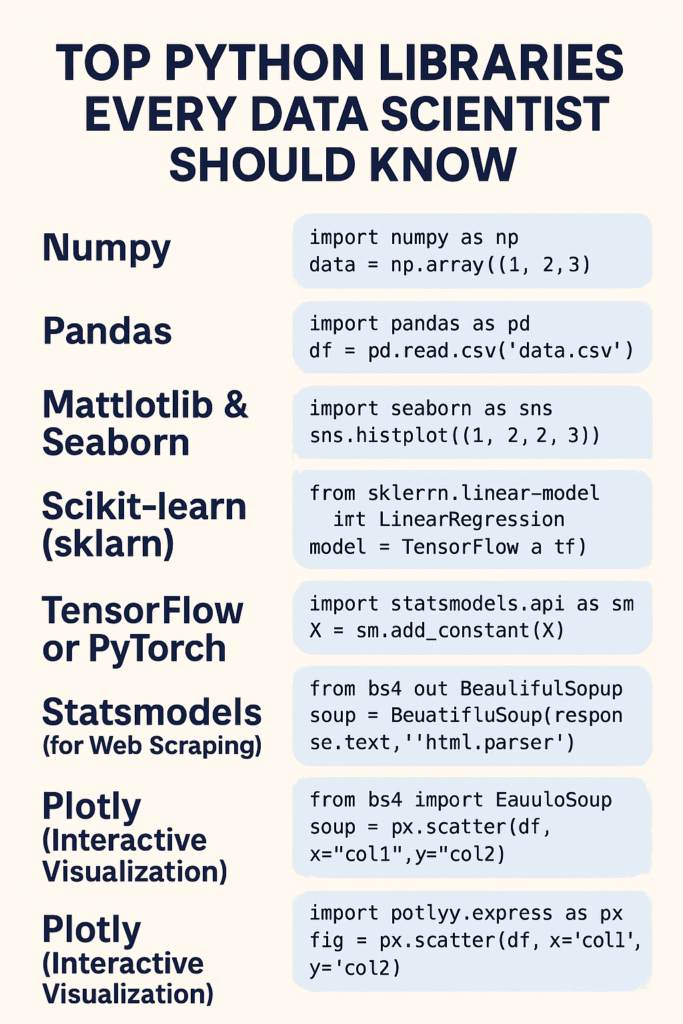
🌟 1. NumPy (Numerical Python)
Why it matters:
NumPy is the backbone of scientific computing in Python. It allows you to work with arrays, matrices, and perform complex mathematical operations efficiently.
Use case: Fast numerical computations like summing large datasets.
pythonCopyEditimport numpy as np

data = np.array([1, 2, 3, 4, 5])
print("Mean:", np.mean(data))
✅ Tip: Learn NumPy before diving into pandas or machine learning—it’s the foundation!
📊 2. Pandas
Why it matters:
If you’re dealing with data in Excel, CSVs, or databases, pandas will become your best friend. It’s used for data cleaning, exploration, and manipulation.
Use case: Load and clean messy data.
pythonCopyEditimport pandas as pd

df = pd.read_csv('data.csv')
print(df.head())
print("Missing values:", df.isnull().sum())
✅ Tip: Always check for missing values in your dataset before analysis.
📈 3. Matplotlib & Seaborn
Why they matter:
Data is boring without visualization. Use Matplotlib for custom plots and Seaborn for beautiful statistical graphs with one-liners.
Use case: Visualizing trends and relationships in data.
pythonCopyEditimport seaborn as sns
import matplotlib.pyplot as plt

sns.set(style="darkgrid")
sns.histplot([1,2,2,3,4,5,5,6,7])
plt.title("Sample Histogram")
plt.show()
✅ Tip: Use Seaborn for fast plotting and Matplotlib when you need more control.
🧠 4. Scikit-learn (sklearn)
Why it matters:
This is your go-to machine learning library. Scikit-learn makes building and evaluating ML models easy with just a few lines of code.
Use case: Training classification or regression models.
pythonCopyEditfrom sklearn.linear_model import LinearRegression
from sklearn.model_selection import train_test_split
from sklearn.datasets import make_regression

X, y = make_regression(n_samples=100, n_features=1, noise=10)
X_train, X_test, y_train, y_test = train_test_split(X, y)

model = LinearRegression()
model.fit(X_train, y_train)
print("Score:", model.score(X_test, y_test))
✅ Tip: Start with simple models like Linear Regression or Decision Trees.
🤖 5. TensorFlow or PyTorch
Why it matters:
These are the top libraries for deep learning and neural networks. TensorFlow is backed by Google, while PyTorch is favored in research and academia.
Use case: Building neural networks, image or text classification.
pythonCopyEditimport tensorflow as tf

model = tf.keras.Sequential([
    tf.keras.layers.Dense(10, activation='relu'),
    tf.keras.layers.Dense(1)
])
print(model.summary())
✅ Tip: Choose one (TensorFlow or PyTorch) and go deep. Both are industry-relevant.
🔍 6. Statsmodels
Why it matters:
For those from a statistics background, Statsmodels offers great tools for hypothesis testing, regression, and time series analysis.
Use case: Linear regression with statistical details.
pythonCopyEditimport statsmodels.api as sm

X = [1, 2, 3, 4, 5]
y = [2, 4, 5, 4, 5]
X = sm.add_constant(X)
model = sm.OLS(y, X).fit()
print(model.summary())
✅ Tip: Use Statsmodels when you need p-values and confidence intervals.
🧹 7. BeautifulSoup (for Web Scraping)
Why it matters:
Data isn’t always in Excel files—sometimes you have to scrape it from websites. That’s where BeautifulSoup shines.
Use case: Extracting headlines from a news site.
pythonCopyEditfrom bs4 import BeautifulSoup
import requests

url = 'https://example.com'
response = requests.get(url)
soup = BeautifulSoup(response.text, 'html.parser')

for headline in soup.find_all('h2'):
    print(headline.text)
✅ Tip: Use with requests or Selenium for dynamic pages.
🌍 8. Plotly (Interactive Visualization)
Why it matters:
Want interactive, clickable graphs? Plotly makes dashboards and presentations much more engaging.
Use case: Creating interactive charts for reports or dashboards.
pythonCopyEditimport plotly.express as px

df = px.data.iris()
fig = px.scatter(df, x="sepal_width", y="sepal_length", color="species")
fig.show()
✅ Tip: Great for building data dashboards and story-telling with visuals.
Final Thoughts 💬
Learning these libraries can feel overwhelming at first, but take it one step at a time. Mastering these tools will supercharge your career in data science, whether you’re working on personal projects or applying for internships and jobs.
🚀 Want to grow faster?
- Start a mini project using pandas and matplotlib.
- Try a Kaggle competition using scikit-learn.
- Scrape data and analyze it using BeautifulSoup + seaborn.
🔑 Key Takeaways
- Start with NumPy & pandas for data manipulation.
- Visualize with Matplotlib/Seaborn, then move to Plotly.
- Apply machine learning with Scikit-learn, then explore deep learning with TensorFlow or PyTorch.


Great article! This is very helpful for beginners like me who are just starting out in data science. Thanks for sharing